Rugby World Cup 2017 - Statistical analysis
Rugby World Cup 2017 - Statistical analysis
There have now been eight Women’s Rugby World Cups (WRWC) which, apart from the first competition that was won by the USA, have been dominated by just two teams – New Zealand and England.
In 2014 WRWC - won by England - there was a suggestion of a potential change. Three teams, Ireland, Canada, and France had emerged whose results suggested they could compete at the very top level. The 2017 competition would indicate whether their progress had developed further over the last three years.
In the event, there was little change – New Zealand and England continued to dominate the event:
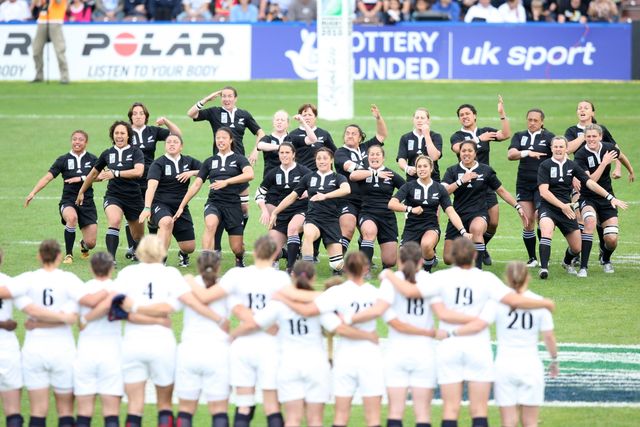
- New Zealand scored 49 tries in five matches. Their winning margins in reaching the final were 32, 33, 44, 121
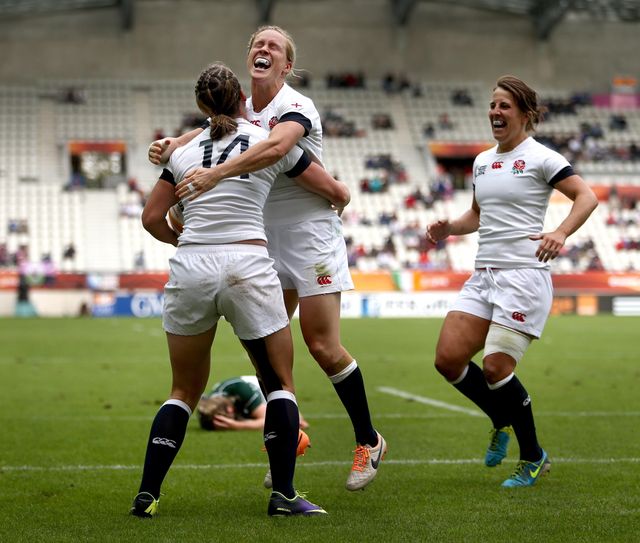
- England scored 33 tries and their winning margins were 17, 21, 43, and 57.
Another pattern seemed to emerge however. There was a clear difference in performance between the six countries that had the range of benefits associated with taking part in the recent Olympics Games and those that either did not, or could not.
Those six teams – New Zealand, England, France, Canada, USA and Canada – took the first six positions, and in the 14 matches they played against the remaining six teams, lost just one - a two-point defeat of Australia by Ireland. This indicates that, currently, Australia is the most vulnerable of the top six teams. In their two matches against Olympics participants, they lost by margins of 48 and 31. Overall, they won two matches and lost three – a similar result to both Wales and Ireland.
One consequence of the varying strengths between the top six and bottom six teams is that winning margins continue to be high:
- 10 or 33% of matches had points margins in excess of 40
- 7 or 23% of matches had points margins between 20 and 40
- Only four of the 30 winning margins were in single figures.
- In two of their five matches, Hong Kong conceded 90 and 121 points respectively
The challenge for women’s world rugby remains - not only to maintain and develop the increasing competitiveness of the leading teams but to encourage and promote the enthusiasm exhibited by all teams that participated in the competition so that the competitive net is widened.
Shape of the Women’s game
The following tables compares the major elements of the game in WRWC 2017 with the women’s game in WRWC 2014 & 2010. The shape of rugby in WRWC 2017 was slightly different, here are some highlights:
- Points & tries per match have increased
- Penalty goals & goal kicking success has decreased
| WRWC 2010 | WRWC 2014 | WRWC 2017 | Difference | |
| Avg pts per match | 40 | 42 | 52 | +10 |
| Winning margin 10 > pts | 7/30 | 7/30 | 6/30 | -1 |
| Avg tries per match | 6.1 | 5.9 | 8.2 | +6.3 |
| Avg penalty goals per match | 1.2 | 1.9 | 0.7 | -1.2 |
| Goal kicking success (%) | 48 | 61 | 53 | -8% |
- Ball in play has increased by 6%
- Passing and rucking rates were higher which suggest the games were faster with more continuity
| WRWC 2010 | WRWC 2014 | WRWC 2017 | Difference | |
| Avg ball in play per match (%) | 44 | 45 | 51 | More |
| Avg passes per match | 239 | 256 | 341 | More |
| Passing rate | 1 in 9s | 1 in 9s | 1 in 7s | More |
| Avg rucks/mauls per match | 161 | 180 | 230 | More |
| Ruck/maul rate | 1 in 13s | 1 in 12s | 1 in 11s | More |
| Avg kicks per match | 33 | 30 | 26 | Fewer |
| Kicking rate | 1 in 65s | 1 in 72s | 1 in 95s | Fewer |
- Penalties, scrums and lineouts per match all decreased
| WRWC 2010 | WRWC 2014 | WRWC 2017 | Difference | |
| Avg lineouts per match (%) | 26 | 24 | 21 | Fewer |
| Lineout success (%) | 76 | 79 | 80 | More |
| Contested lineouts (%) | 39 | 44 | 39 | Fewer |
| Avg scrums per match | 24 | 21 | 18 | Fewer |
| Scrum success (%) | 87 | 89 | 92 | More |
| Contestable 50m restart success (%) | 25 | 19 | 20 | Similar |
| Avg PKs / FKs per match | 25 | 23 | 18 | Fewer |
| Total cards | 64/2 | 27/1 | 28/1 | Similar |
A comparison with the men’s game
The following tables compares the major elements of the game in WRWC 2017 with the men’s game in RWC 2015. The comparison shows women’s of rugby is slightly different, here are some highlights:
- Try scoring dominates women’s rugby with only 4% of points coming from penalty goals (RWC 28%)
- Goal kicking success is lower in WRWC
| Women's RWC 2017 | Men's RWC 2015 | |
| Pts from tries (%) | 80 | 56 |
| Pts from penalty goals (%) | 4 | 28 |
| Tries scored by backs (%) | 60 | 64 |
| Tries scored by forwards (%) | 40 | 36 |
| Conversion success (%) | 51 | 72 |
| Penalty goal success (%) | 69 | 78 |
- More passes and rucks per possession with fewer kicks in WRWC
- More ball in play
- Higher proportion of passes by backs
| Women's RWC 2017 | Men's RWC 2015 | |
| Ball in play | 40m 54s (51%) | 34m 55s (44%) |
| Passing rate | 1 in 7.2 secs | 1 in 7.4 secs |
| Passes made by backs (%) | 41 | 33 |
| Passes made by scrum half (%) | 41 | 49 |
| Passes made by forwards (%) | 18 | 18 |
| Rucking rate | 1 in 10.7 secs | 1 in 11.8 secs |
| Ruck/maul possession retained (%) | 94 | 94 |
| kicking rate | 1 in 95 secs | 1 in 54 secs |
- More scrums with higher retention in WRWC
- Fewer lineouts with lower retention
- Fewer penalties/free kicks
| Women's RWC 2017 | Men's RWC 2015 | |
| Scrums | 18 | 13 |
| Scrums retained (%) | 92 | 86 |
| Lineouts | 21 | 26 |
| Lineouts retained (%) | 80 | 87 |
| PK /FK | 18 | 23 |
| Cards | 0.9 | 1.1 |