Game Analysis - Men's Six Nations 2023
2023 Six Nations - Men's
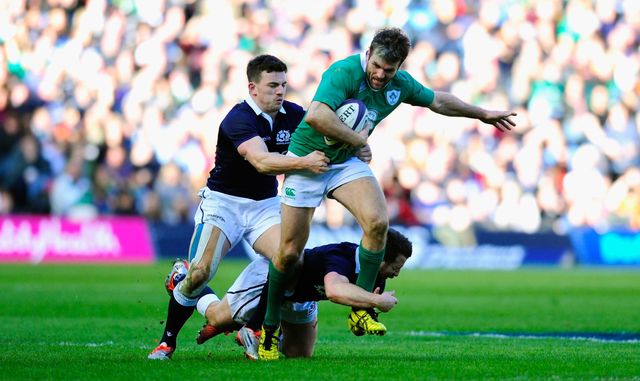
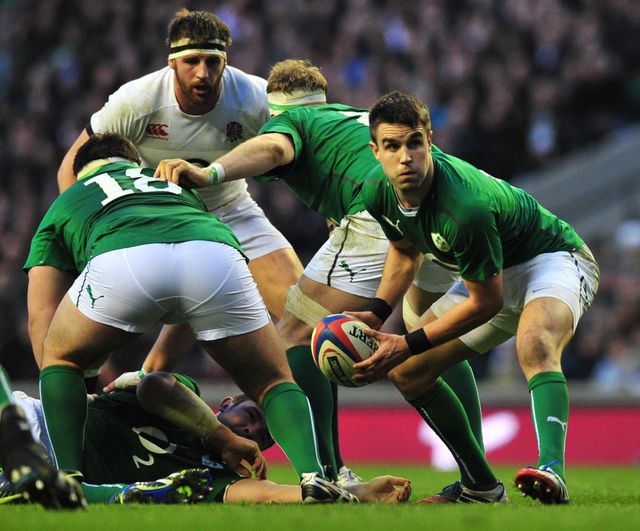
Ireland & France
IRELAND
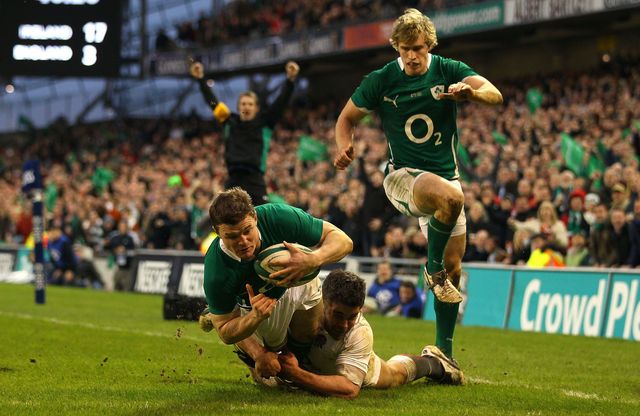
Ireland were the 2023 Grand Slam winners, winning all five of their matches and beating France, their closest rival, 32-19.
- They scored 20 tries, one fewer than France.
- They won four try-bonus points in their five matches.
- They averaged 30 points per game.
- They had by far the best defence, conceding only six tries while every other team conceded at least twice as many.
- They had more total possession than any of the other teams.
- They pressurised teams from the start, scoring 60 per cent of their points in the first half.
- They had the second-highest rate of passing and made the second-highest number of passes.
- They were the fastest rucking team and had the best ruck retention rate.
- Fifty per cent of their tries came from 7+ passing movements, a far higher proportion than any other team.
- They mauled the most.
- Their forwards scored almost half their tries – nine of 20.
- They scored from all sources of possession.
- They were awarded 20 per cent more penalties than their opponents.
- They were the only team not to receive a single yellow or red card.
FRANCE
France won four of their five matches, losing only to Ireland.
They had a young and relatively inexperienced squad with their 42-man squad containing 19 with fewer than 10 caps and only one with more than 50. The squad average was 15. This was in sharp contrast to Ireland, their major challenger, whose squad averaged 40 caps per player, with 13 players with 50 or more.
- They scored the most points, averaging 35 points per game.
- They scored the most tries.
- They won four try-bonus points from their five matches.
- They had the lowest overall possession than any other team and their opponents had more than any other team’s opponents.
- Of the six matches with lowest ball in play times, France were involved in four.
- Territory was favoured over possession.
- They kicked the most with their scrum-half making more kicks than any other teams’ scrum-half.
- They rucked the least.
- They had the lowest rate of passing.
- They scored tries from all sources of possession with almost 60 per cent coming from open play. Of the 11 tries scored from turnovers, for example, they scored five.
- They also scored more tries than any other team from possession gained inside their own half which accounted for 25 per cent of all their tries.
- They had the highest goal-kicking success rate and they kicked the only drop goal.
Margins
Two years ago in the Six Nations, one of the striking factors was the closeness of many of the matches and the tightness of winning margins. This excluded Italy, who suffered five heavy defeats, conceding around 50 points per game.
When Italy’s results were isolated, eight of the remaining 10 matches had margins of just five points or fewer. This was not repeated in 2022, however, where the corresponding number was down to three and margins noticeably increased.
In 2023, the margins increased again and not one of the eight games had a margin of five or less. This is shown in the following table:
|
MATCH |
MARGIN IN 2021 |
MARGIN IN 2022 |
MARGIN IN 2023 |
|
England v Scotland |
5 |
3 |
6 |
|
Wales v Ireland |
5 |
22 |
24 |
|
Scotland v Wales |
1 |
3 |
28 |
|
Ireland v France |
2 |
6 |
13 |
|
France v Wales |
2 |
4 |
13 |
|
France v Scotland |
2 |
19 |
11 |
|
Scotland v Ireland |
3 |
21 |
15 |
|
England v France |
3 |
12 |
43 |
The table is a confirmation of the increasing strength of Ireland and France relative to England, Scotland and Wales as also seen in the World Rugby Rankings.
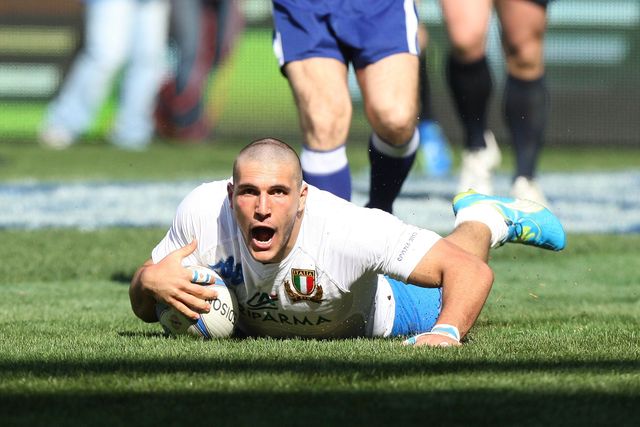
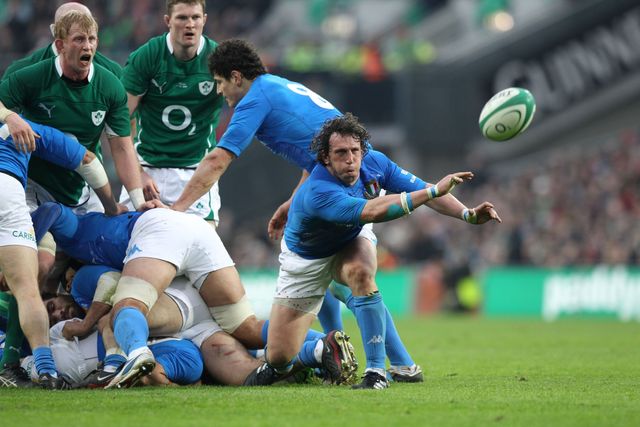
Italy
Despite winning only one of their last 45 Six Nations matches. Italy have seen a major improvement in their performance over the years. In this year’s tournament, Italy’s average losing margin was 12 points. Only once in the last 15 years has Italy’s average losing margin been fewer than 12 – and that was in 2013.
This improvement is also illustrated in the following table, which shows that their average losing margin of 37 points in 2021 has been reduced to 12 points in 2023.
|
MATCH |
MARGIN IN 2021 |
MARGIN IN 2022 |
MARGIN IN 2023 |
|
Italy v France |
-40 |
-27 |
-5 |
|
Italy v England |
-23 |
-30 |
-17 |
|
Italy v Wales |
-41 |
+1 (win) |
-12 |
|
Italy v Ireland |
-38 |
-51 |
-14 |
|
Italy v Scotland |
-42 |
-11 |
-12 |
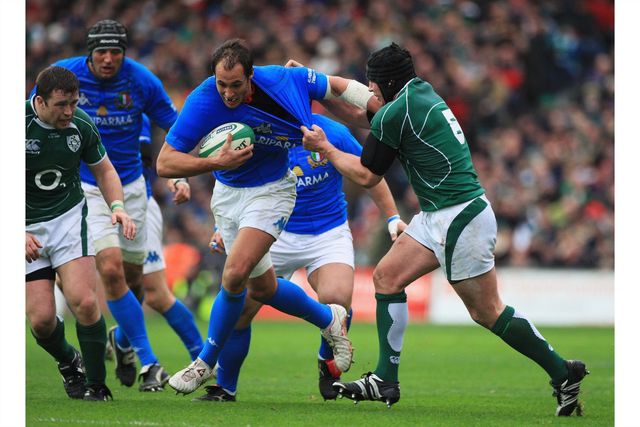
Furthermore, in this year’s tournament, despite losing all five matches, Italy gave Ireland and France their closest matches:
- Against France, in the 67th minute, Italy were leading 24-22.
- Against Ireland in the 70th minute, Italy were within one score at 20-27.
The improvement in Italy’s performance followed the adoption of a clear playing strategy. This was delivered by the youngest squad in the tournament with an average age of 25. Almost 50 per cent of the squad had fewer than 10 caps and only one player had more than 50.
Their strategy involved:
- Retaining possession
- Distributing the ball in all parts of the pitch
- Keeping the ball alive
- Playing at pace
Match data shows that:
- Italy had the most possession in four of their five matches.
- They kicked the least.
- They made the most passes.
- Their backs passed proportionally more than any other teams’ backs.
- Italy’s scrum-half was the most likely scrum-half to pass the ball. He also kicked the least.
- Their fly-half was the most likely fly-half to pass the ball.
- They had the highest number of 3+ passing movements.
- They had the highest rate of passing.
- They had the fasted ruck speed over all parts of the pitch.
ITALY UNDER-20S
At the same time as the Six Nations was played, the U20 Six Nations took place where Italy finished third, their highest-ever position.
They achieved this by playing a game that was quite different from that adopted by their senior team. It was a heavily forward-driven approach and while a playing strategy can be dictated by the physicality and skillset of a squad of players, the extent of the difference between the approaches of a country’s two national teams was unusual.
A measure of some differences can be seen in the following examples.
|
2023 ITALY SIX NATIONS |
2023 ITALY U20 SIX NATIONS |
|
Made the most passes |
Made the fewest passes |
|
177 passes per game |
87 passes per game |
|
Most likely scrum-half to pass the ball |
Least likely scrum-half to pass the ball |
|
Least likely scrum-half to kick |
Second most likely scrum-half to kick |
|
Highest rate of passing |
Lowest rate of passing |
|
highest number of 3+ passing movements |
Lowest number of 3+ passing movements |
|
Of nine tries, one driven over by forwards |
Of 24 tries, 19 driven over by forwards |
Try Scoring
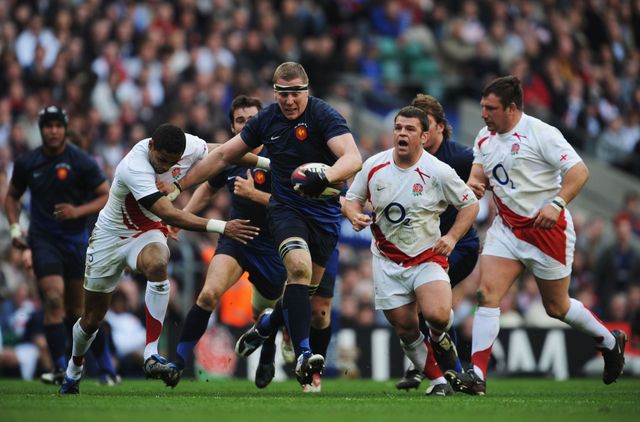
England’s performance saw them finish in fourth position. Over the last three years, they have finished in fourth, third and fifth. In each of those years, they have lost more matches than they have won. This is in sharp contrast to the earlier years of the previous decade where they came first three times and second three times.
One statistic from this year’s tournament showed that overall 66 per cent of tries were scored by backs and the table below shows that of the six teams, five saw their backs score more tries than their forwards. England were the only exception as their forwards scored the same number of tries as their backs, just as they did in the 2022 Six Nations.
The table, which covers the last two years, shows that England’s backs have scored a total of 10 tries in as many matches – an average of one per game. At the same time, and over this period, England’s scrum-half, fly-half and centres proved to be the most likely backs to kick the ball.
|
|
|
2022-23 SIX NATIONS |
|||
|
|
|
TOTALTRIES |
BACKS |
FORWARDS |
PENALTY TRY |
|
|
IRE |
44 |
26 |
18 |
|
|
|
FRA |
38 |
27 |
11 |
|
|
|
SCO |
28 |
23 |
4 |
1 |
|
|
WAL |
19 |
12 |
6 |
|
|
|
ITA |
14 |
11 |
2 |
1 |
|
|
ENG |
21 |
10 |
10 |
1 |
Overall, England conceded twice as many tries in the second half as in the first half.
Tries can be categorised in a number of ways and in the modern game there is often a noticeable distinction between two distinct groups – those that come from open play and forward-orientated driven tries.
This could be seen in this year’s Six Nations where three of France’s tries were forward-driven while 18 came from open play. This was in sharp contrast to England, who scored eight of their 13 tries through their forwards.
The breakdown between all six teams is shown in the table below:
|
|
|
TRIES FORWARD DRIVEN |
TRIES FROM OPEN PLAY |
TOTAL |
|
|
ENG |
8 |
5 |
13 |
|
|
IRE |
6 |
14 |
20 |
|
|
WAL |
5 |
6 |
11 |
|
|
SCO |
5 |
12 |
17 |
|
|
FRA |
3 |
18 |
21 |
|
|
ITA |
2 |
7 |
9 |
|
|
TOT |
29 |
62 |
91 |
Penalty Goals
The number of penalty goals kicked in this year’s championship was 40 – the lowest total for at least 10 years. In that period, the average was 63 per tournament, or almost 60 per cent more.
There were also far fewer penalty attempts at goal. The 48 penalty goal attempts this year compared with the 121 attempts at goal in 2013 shows the extent of this change.
This is the result of the penalty now being regarded more as a vehicle for strategic possession than a direct method of accumulating points. Possible points are being turned down by kicking for touch with the intention of scoring tries from close lineout possession.
A consequence is that this year, for the first time in at least 10 years, more than 50 per cent of tries were scored from possession obtained from inside the opposition 22m line. This compares with 44 per cent over the previous decade.
Scrums
There was a time when the percentage of tries scored from lineout possession and the percentage of tries scored from scrum possession were very similar with each accounting for some 20 per cent of all tries.
This has moved over the years with, currently, three times as many tries being scored from lineout possession as from scrums. In this year’s Six Nations, for example, 44 per cent of tries originated from lineout possession while 15 per cent came from scrums.
This is because scrums have changed.
- There are now far fewer with an average of 11 per game in this year’s competition. In one match there were only five, in another match there were seven and in two there were eight.
- Frequently there are long periods of the game with no scrums. In this year’s tournament, one match saw just one scrum in the second half. In another there were just two and in a third there were two periods in excess of 20 minutes where there were no scrums.
- Scrums are now often seen not so much as a source of valuable possession but as a source of winning penalties, with almost 50 per cent of scrums currently ending in a sanction.
- This struggle for penalties can take time, with scrums averaging around 70 seconds to complete. Two scrums this year took more than two minutes and 10 took over 100 seconds.
- One result is that front-row players now have quite different workloads. Instead of participating in upwards of 25 scrums per game and playing for 80 minutes, they are now more likely to be on the field for around 65 minutes and participate in an average of six scrums per game which is what happened in this year’s Six Nations.
Scrums have also changed in other ways. While scrums took around 25 seconds to complete in the amateur era, they now take around 70 seconds.
They also contain many more stoppages in play. In this year’s tournament, for example, on 35 per cent of occasions after the referee had blown for a scrum, he called for time off in order to deal with some form of intervention, the majority of which were for injuries.
The 35 per cent mentioned above was a reflection of the whole tournament. The percentage of intervention stoppages varied, however, between the six teams. This is shown in the following table, where the intervention rate in France scrums was 58 per cent while in Scotland scrums, it was 11 per cent.
|
% OF SCRUMS CONTAINING A STOPPAGE |
|
|
FRA |
58% |
|
ENG |
52% |
|
IRE |
45% |
|
WAL |
30% |
|
ITA |
29% |
|
SCO |
11% |
|
TOT |
35% |
Players
There are a range of requirements that determine the country a player is able to represent. These are based on birth, family, and playing location. The two tables below show the number and percentage of players who were born in the country they represented in this Six Nations tournament, and the country in which they played their rugby.
|
|
% BORN IN COUNTRY REPRESENTED |
|
|
ENG |
32 of 36 |
89% |
|
FRA |
37 of 42 |
88% |
|
IRE |
30 of 37 |
81% |
|
WAL |
30 of 37 |
81% |
|
ITA |
28 of 34 |
82% |
|
SCO |
19 of 40 |
48% |
|
TOTAL |
176 of 226 |
78% |
|
|
% PLAYING IN COUNTRY REPRESENTED |
|
|
ENG |
35 of 36 |
97% |
|
FRA |
42 of 42 |
100% |
|
IRE |
37 of 37 |
100% |
|
WAL |
31 of 37 |
84% |
|
ITA |
25 of 34 |
74% |
|
SCO |
25 of 40 |
63% |
|
TOTAL |
195 of 226 |
86% |
Overall Summary
The following tables show the overall shape of the game data.
|
|
2023 SIX NATIONS |
||
|
|
AVERAGE |
LEAST |
MOST |
|
POINTS |
48 |
29 |
69 |
|
TRIES |
6.1 |
4 |
9 |
|
CONVERSIONS |
4.4 |
2 |
9 |
|
PENALTY GOALS |
3 |
0 |
5 |
|
DROP GOALS |
1 in 15 matches |
0 |
1 |
|
BALL IN PLAY |
37m38s (47%) |
33m 47s (42%) |
45m 30s (57%) |
|
PASSES |
314 |
230 |
398 |
|
RUCKS |
185 |
134 |
228 |
|
MAULS |
11 |
3 |
20 |
|
KICKS |
55 |
37 |
77 |
|
LINEOUTS |
26 |
14 |
34 |
|
SCRUMS |
11 |
5 |
16 |
|
PKS/FKS |
23 |
15 |
31 |
|
CARDS |
1 |
0 |
3 |
|
TMO REFERRALS |
32 |
1 |
4 |
|
TMO TIME TAKEN |
99s |
41s |
194s |
|
|
2023 SIX NATIONS |
|
MATCHES WON BY SCORING MOST TRIES |
15 of 15 |
|
MATCHES WITHIN SEVEN POINTS |
2 of 15 |
|
MATCHES WON BY THE TEAM WITH MORE POSSESSION |
4 of 15: 2 equal |
|
MATCHES WON BY THE AWAY TEAM |
8 of 15 |
|
MATCHES WON BY TEAM WINNING AT HALF-TIME |
14 of 15 = 93% |
|
TRIES SCORED IN THE FIRST HALF |
49% |
|
PENALTY GOALS SCORED IN THE FIRST HALF |
75% |
|
TRIES SCORED BY BACKS |
66% |
|
TRIES SCORED BY BACKS/FORWARDS/PEN TRY |
66%/31%/3% |
|
POINTS PER YELLOW CARD |
7,7,7,7,7,5,5,4,3,0,0,0 |
Full reports - Northern and Southern hemisphere championships
Below you can download full reports for the major championships played in the northern and southern hemispheres, provided by the World Rugby Game Analysis department.